While scanning through my chart at the close of business on Friday 9th September, 2016 something attracted me to Zenith Bank trading patterns, so I decided to spend quality time to read the trend. You will be surprised to learn that I was on it for 3 days before finally taking my decision.
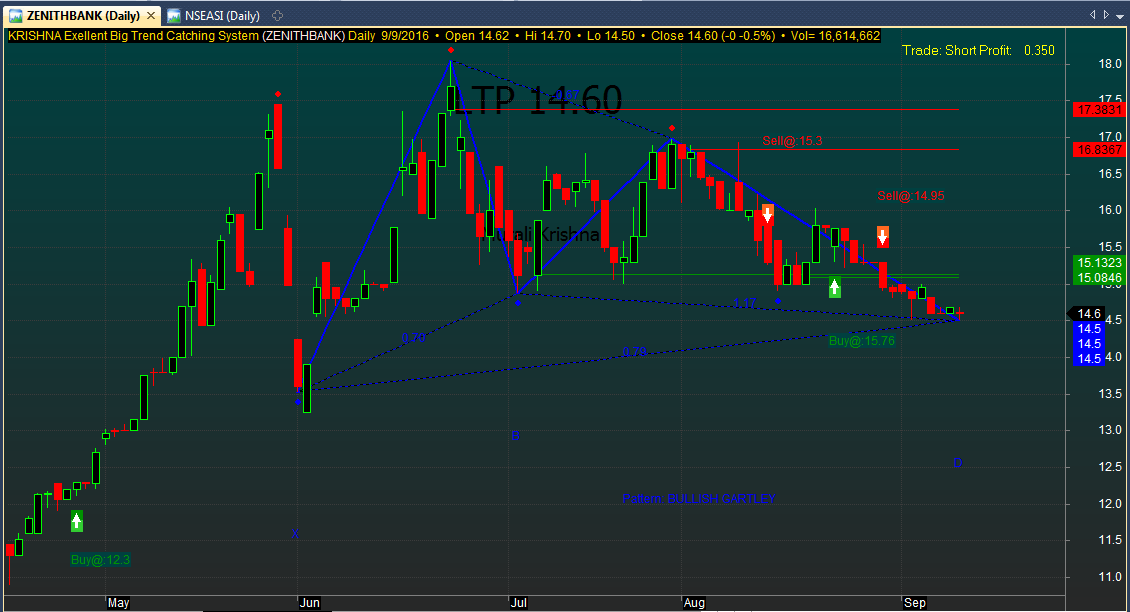
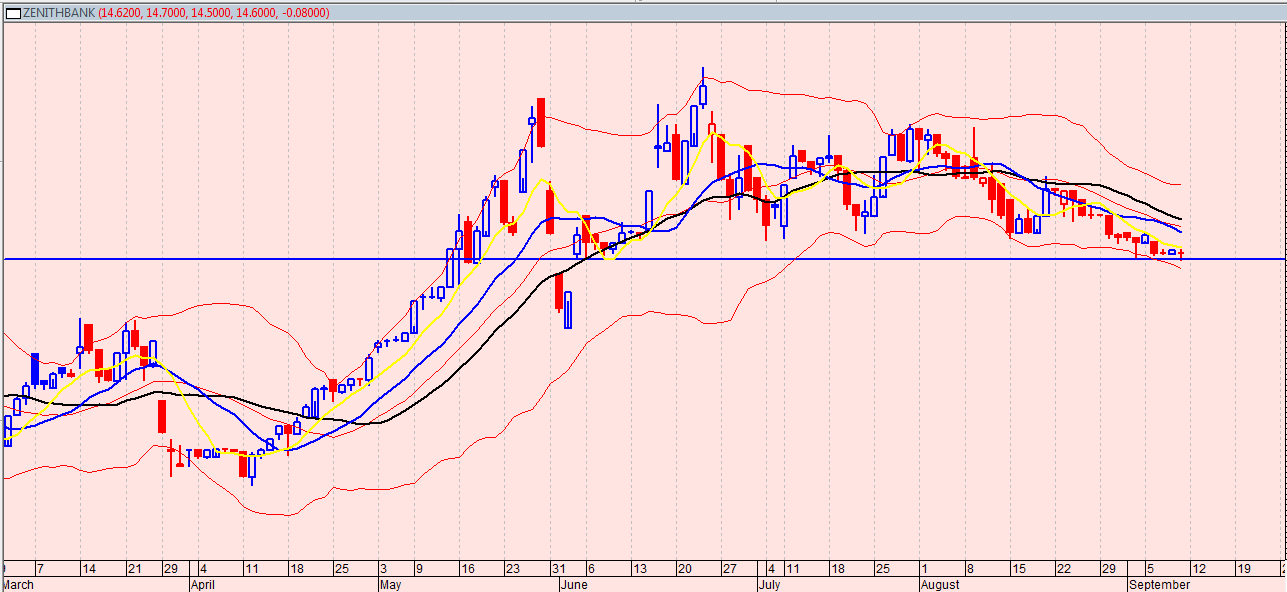
After testing the attractiveness with 3 points moving averages, trend, candlestick patterns and Bollinger bands, I decided test with Gartley Pattern. Gartley pattern uses Fibonacci Retracement ratios to determine both buy and sell signals. What it actually does is to measure price retracement of a stock’s up and down movement. Not to bother you with all the technical jargons, this is what I think.
- As can be seen below, judging by Gartley, Zenith is currently a buy anywhere from the current market price. Although it should be noted that a defied support (now turned resistant) awaits the stock around N15.13. That is for traders, targeted gap should be less than 50k, and this is so since the general market fundamental is currently weak, meanwhile, medium term positions should return better profit. Findings from other indicators tested are as stated below.

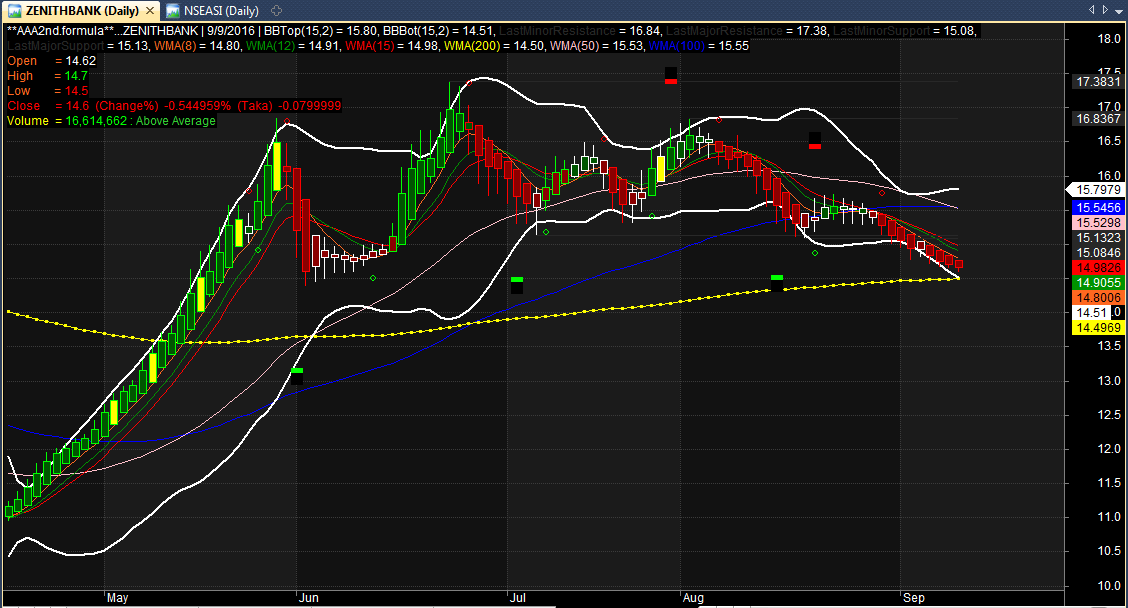
- Zenith Bank has a strong support around N14.52, thus, all things being equal the stock should rebound anywhere from the current price.

- The volume price analysis indicator confirms that the stock very close to a buy

- The buying and selling status of the stock is looking up at Volume index of 0.34x
Please note that as much as this are tested indicators, I do not guarantee 100% success as several market fundamentals may reversed the readings from time to time. Safe Trade.


Comment here