Company: Transnational Corporation of Nigeria Plc (Transcorp)
Rating: Buy
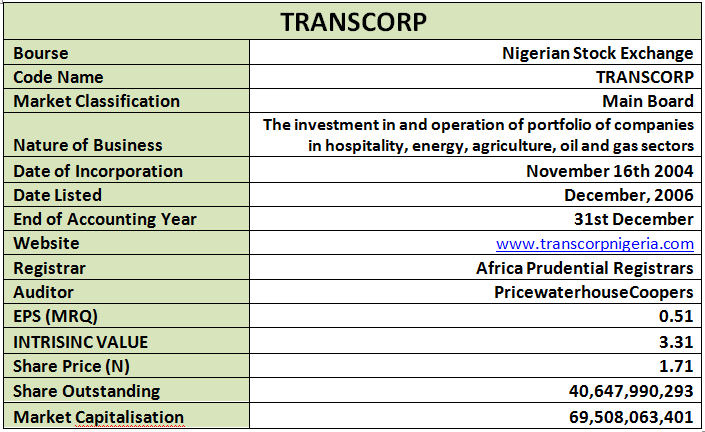
Current Market Price at Earnings Release: N1.71
Intrinsic Value: N3.31
Latest Cash Div: N0.03
By: Jeariogbe Tunde Segun (Equity Analyst)
Key Financial Tickers:
- This report observed the full year financial performance indices of Transcorp for the year ended 31st December, 2019
- Generally, the result is a doubled position when compared with the financial statistics released for the year ended 31st December, 2017.
- At the end of the year, UBA Nominees Limited, held 9.26% of the company’s issued share capital while Mr Tony O. Elumelu, CON held 2.07%, aside this two, no other individual/organization held more than 5% of the company’s issued share capital as at the end of 31st December, 2018.
Dividend Information
- Current Dividend: N0.03
- Closure Date: 1st March, 2019
- Qualification Date: 28th February, 2019
- Payment Date: 19th March, 2019
- Agm Date: 15th March, 2019
- Agm Venue: Transcorp Hilton Hotel, 1 Agunyi Ironsi Street, Maitama

Corporate Figures
Profit/Loss
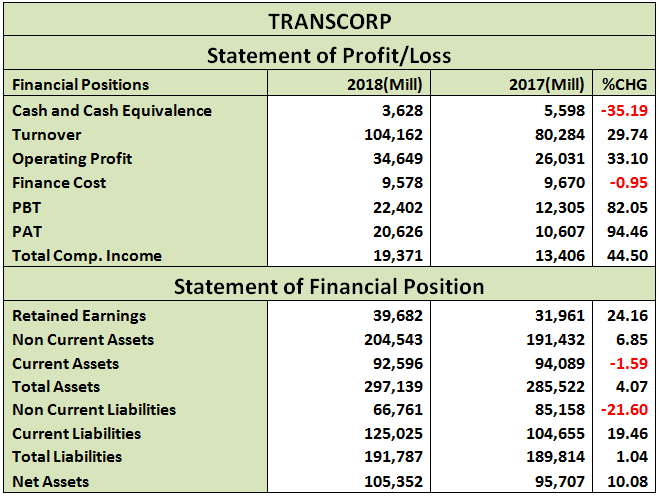
- At the end of 2018 financial year, Turnover (termed as revenue from contract with customers in the report) grew by 29.74% over comparable year figure having moved from N80.284 billion to the current N104.162 billion.
- Breaking down the income, it was observed that the power business contributed most to the TO value as it contributed N86.737 billion (76.72%) while Hospitality contributed N17.424 billion (15.41%) and Corporate businesses generated N8.899 billion (7.87%)
- Cost of Sales recorded through the year was N55.910 billion as against the previous N43.860 billion. Major booster of Cost of Sales is the N46.068 billion (N35.217 billion-2017) attributed to natural gas and fuel costs.
- Operating Profit stood at N34.649 billion, same as 33.10% above the N26.031 billion achieved at the end of 2017 financial year
- Finance Cost only adjusted down by 0.95% from N9.670 billion to N9.578 billion.
- Both Profit before Tax (PBT) grew by 82.05% as it is currently valued at N22.402 billion as against N12.305 billion
- Profit for the period (PAT) almost doubled at 94.46% improvement. Please note that the current earnings for the year is N20.626 billion as against N10.607 billion.
- Due to net loss on equity instruments (N1.254 billion) for the year, the Total Comprehensive Income for the period stood at N19.371 billion as against N13.406 billion reported in 2017

Financial Positions
- Retained Earnings improved by 24.16% having grown to N39.682 billion from N31.961 billion.
- Non Current Assets is currently valued at N204.543 billion as against the previous N191.432 billion reported in 2017
- Meanwhile as a result of lower Cash and Short term deposits, Current Assets dropped marginally by 1.59% as the item is currently valued for N92.596 billion as against N94.089 billion
- Non Current Liabilities dipped by 21.60% as it currently stood at N66.761 billion as against N85.158 billion.
- Current Liabilities reported for the year stood at N125.025 billion as against N104.655 billion in 2017. Difference between the two financial year is same as 19.46%
- Meanwhile, Total Current Interest Yielding Loans and Borrowings is N54.174 billion (2017- N36.509 billion) and Non Current Interest Yielding Loans and Borrowing N57.373 billion (2017- N75.589 billion)
- In all, Total Interest bearing Loans and Borrowings for the year is N111.547 billion as against N112.099 billion in 2017
- In other words, Total Liabilities for the year is N191.787 billion against N189.814 billion of last year
Liquidity/Risk Ratios
- Considering both Current and Non Current liabilities reported for the year, we have estimated the Total Debt as 182.04% of the reported Equity; this is largely above the industrial average of 38.92%
- Current Ratio stood slightly below unity at 0.96x as against 25.71x industrial average.
- The company’s beta value is estimated at 2.12x as at the time of this report, this is far above unity and signifies high patronage/liquidity
- With interest coverage of 3.62x the company can settle interest yielding loans as at when due

Profitability Ratios
- Cost of Sales is currently estimated at 53.68% of the Turnover value, this is 1.75% below the 54.63% estimated from the 2017 financial data
- Profit Before Tax Margin estimated for the year under review is 21.51% same as 40.32% above the 15.33% achieved last year.
- Similarly, Profit Margin is 19.80% at 49.88% above the 13.21% estimated at the end of 2017 financial year
- Return achieved on Average Equity is currently 19.58% as against 11.08%
- Return on Average Assets is 6.94%
- See below table for details

Efficiency Ratios
- Total Assets Turnover ratio, a test of management efficiency, is estimated at 35.06%, this is 24.67% above the 28.12% estimated last year
- Equity Turnover on the other hand, improved by 17.86% at the estimated 98.87% against 83.89%
- In other words, Equity was multiplied 2.82 times as against the 2.98 times achieved in 2017
- Fixed Assets Turnover on the other hand improved by 24.67% having moved from 28.12% to 35.06%

Investment Ratios
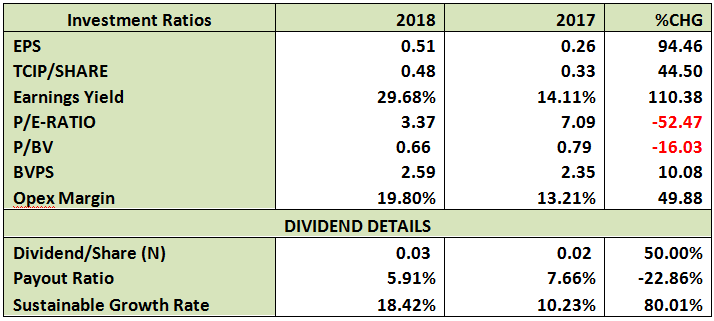
- Reflecting the profit growth reported above, the estimated amount earned per units of shares (note total shares outstanding remains same) of Transcorp is N0.51 as against the previous estimate of N0.26
- The said earnings is a yield of 29.68% of the current market price on the exchange floor as at the date the result was released to the market. This is far better than the 14.11% yield estimated last year, even when the price was lower
- Price earnings Ratio (PE/Ratio) moderated to 3.37x as against 7.09x
- As against the N1.71 price on the floor of the exchange as at the released of result, the estimated Book Value per units share is N2.59
- Further confirming the fairly underpriced position was the Price to Book Value ratio that stood below unity.
- Also checked is the Operating Expenses Margin to the Turnover figure. We have currently estimated 19.80% margin as against the previously estimated 13.21% margin
- Our estimates have revealed that the currently paid N0.03 is same as 5.91% of the year’s earnings, in other words, the Retention ratio is 94.09%

Valuation
While trying to place a fair value on each units of Transcorp shares, we explore a blend of Capital Assets Pricing Model (CAPM) with Gordon Growth Model, we therefore derived an implied growth rate and required returns. Our Assumptions is that the management of Transcorp will maintain its dividend payment growth over the years. Thus, we have fairly priced its shares for N3.31.


Comment here