Company: P Z CUSSONS NIGERIA PLC. (PZ)
Rating: Buy
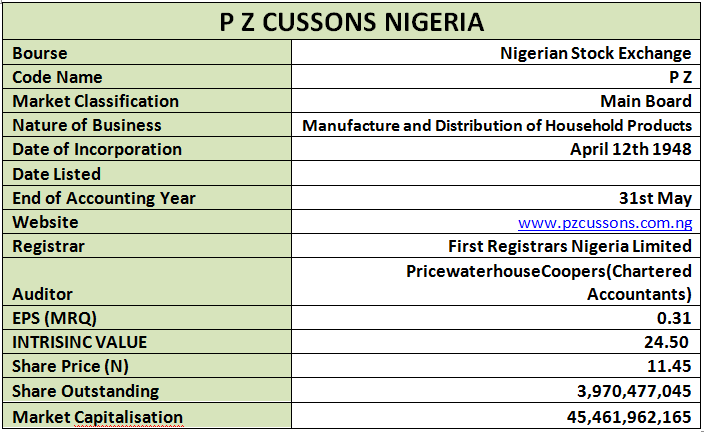
Current Market Price at Earnings Release: N11.45
Intrinsic Value: N24.50
Latest Cash Div: N0.15
By: Jeariogbe Tunde Segun (Equity Analyst)
Key Financial Tickers:
- This report observed the half year financial performance of Pz Cussons Plc, for the period ended 30th November, 2018. Meanwhile, full year indices were utilized in arriving at the intrinsic value for each unit of its shares.
- The improved performance posted during the period was impacted by the reduced foreign exchange loss. According to the released document, a Foreign exchange loss for the period was N524.97 million as against the N2.572 billion loss suffered in the similar period of 2017
- Further impacting the positive performance was the lower Administrative Expenses posted in the current year (N1.988 billion-2018 as against N3.813 billion-2017)
The Company’s Product/Strength
- PZ Cussons Nigeria Plc (formerly Paterson Zochonis Industries Plc) is a diversified conglomerate engaging primarily in the manufacture and sale of a wide range of consumer products and home appliances. PZ has a wide range of product portfolio which includes;
- Personal and Home Care products and appliances which are leading brands in detergents, soap, pharmaceuticals, cosmetics, confectionery,
- Refrigerators, freezers, air-conditioners, plastic containers and components.
- The group also distributes the milk products of Nutricima Limited, a related company.
- PZ is a highly diversified conglomerate with main focus on the Fast Moving Consumer Goods (FMCG’s) market.
- PZ has a product portfolio made up of established and highly-valued brands like Elephant detergent, Joy beauty soap, Robb etc
- Continuous product innovation has impacted on turnover growth
- It has properly managed production cost levels relative to competitors.
- The company’s stock is defensive, given its low share price volatility and the possibility of only little variation in earnings.

Corporate Figures
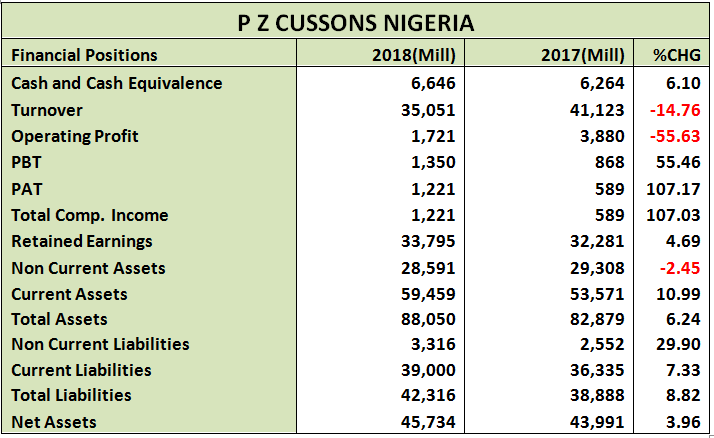
- Total Turnover (TO) reported for the first three months of 2018 is 14.76% below the corresponding quarter in 2017. A total of N35.05 billion was posted for the three months as against the N41.123 billion TO reported in Q1-2017
- Selling and distribution expense was 10.5% above what was reported in 2017. The index moved from N4.632 billion to N5.117 billion
- Similarly, Administrative Expensive posted for the year reduced to N1.988 billion from N3.813 billion
- Thus, Operating Profit stemmed below the 2017 figure. Having reduced to N1.721 billion from the previous N3.88 billion posted in 2017
- Profit before Tax was estimated for N1.35 billion compared to the N868 million reported for same period in 2017
- Having considered Tax Expenses for the period, N1.22 billion was reported as the Profit for the period, this is 107.17% below corresponding quarter’s profit of N589 million.
- Retained earnings mildly improved over the corresponding period by 4.69%, moving from 281 billion to N33.795 billion
- Non Current Assets printed slightly below what was reported in the previous quarter of 2017. In the report under analysis, it was estimated at N28.59 billion as against N29.30 billion in 2017
- Meanwhile, Current Assets improved by 10.99% from the previously reported N53.57 billion to N59.45 billion
- Non Current Liabilities on the other hand grew by 29.90% as it is currently estimated at N3.31 billion compare to the N2.55 billion posted in third quarter of 2017
- Current Liabilities is currently valued at N42.31 billion, this is 8.82% above the N43.99 billion reported in 2017.

Liquidity/Risk Ratios
- Current Ratio stood above unity implying the strength of the company in settling its current liabilities as at when due.
- The beta value which measures the volatility of the equity on the floor of the exchange stood below market beta and also below the industrial average. Signifying reduced volatility
- Interest coverage is far below the industrial average, currently it is estimated at 2.15x implying the ability to take care of interest due on its interest yielding liabilities. Please understand that improvement is strictly required else, accessing further interest yielding liabilities will pose lots of challenges to the company’s income

Profitability Ratios
- Cost of Sales margin is currently estimated at 74.82% slightly above the 70.03% estimated last year.
- Profit before Tax margin is 3.85% also above the 2.11% margin estimated from the corresponding quarter figures
- Meanwhile, Profit after Tax margin soared against that of Q1-2017. We have currently estimated N3.48% as against the previous N1.43%
- Return on Average equity is currently estimated at N36.83% far above the 23.09% achieved in similar period of 2017
- Return achieved on Average Assets now 1.85% as against 0.99%

Efficiency Ratios
- Testing the management efficiency, the Asset Turnover was gauged, the Ratio declined by marginal 19.77% from 49.62% to 39.81%.
- Also tested was the Equity Turnover, which currently stood at 76.64% as against the 93.48% estimated in 2017
- In other words, the equity was multiplied 1.93 times through the first three months of 2018 financial activities, slightly above the 1.88 times in Q1-2017.
- It was also estimated that Fixed Assets turnover is same as 122.6% below the 140.31% estimated in Q1-2017

Investment Ratios
- Following same trend as in the earnings the amount earned per unit of Pz Cussons Plc in its Q3- financial performance, Earnings per Share (EPS) improved by 107.17% against the comparable period of 2017. The current EPS estimate is N0.31
- Price Earnings Ratio (PE/Ratio) is currently estimated at 9.31x as against the previous 37.88x. Although this is mainly used in confirming investment recouping time, it is also indicating investors’ sentiments on the price of Pz Cussons
- As we speak the book value of Pz Cussons is currently N0.84 above the N1.43% in 2017. When this is placed side by side the current market price, one might be tempted to declare an overpriced position.

Valuation
In valuing PZ Cussons, a number of valuation metrics, such as Price-to-Book Value method, Price-to-Sales method, Price-to-Earnings method and Discounted Cash Flow method (with a discount rate of 15.09%), were used. After applying appropriate weights with bias for Price–Earnings valuation and Price-to-Sales valuation, we arrived at a fair value of N24.50 per share. On the strength of this, we have rated that share of P Z Cussons a Buy.


Comment here